A national consumer finance company was opening locations at an aggressive pace. They partnered with YakData to empower regional managers to tactically schedule staff to meet or exceed net revenue and margin targets. At the same time, the CEO wanted to improve shared situational awareness among the executive team and their direct reports. For both phases of this project, we utilized R, Redshift, Excel, Tableau and Tableau Server. At the conclusion of this multi-phase engagement, our client was able to effectively enhance their growth strategy and greatly increase new salesforce hire ROI.
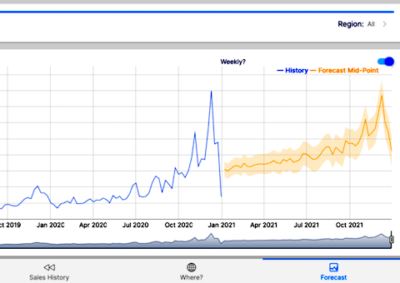
We worked with the executive and analytics teams to build a dynamic dashboard composed of hierarchical loan volume forecasts at the state and regional levels. We included controls for simulating various levels of salesforce growth. This project deliverable sparked better communications among and within the regions to efficiently allocate quarterly salesforce hires with less contention and quicker buy-in.