Revealing value for a leading Biotech: forecasting a 9-figure product-line acquisition
At a glance
A growing biotech wanted to evaluate the ten-year value of acquiring a complementary product line, in whole or in part. We built flexible forecasting models and executive-friendly dashboards and workbooks using R, dbt, PostgreSQL, Tableau and AWS. Our client was able to examine numerous scenarios at several valuations under a variety of future conditions to confidently acquire products that will maximize shareholder value.
what we delivered
Powerful and flexible forecasts, dashboards, and scenario modeling analyses for rapid investigation and valuation of future scenarios by the product acquisition team.
Advanced models and hierarchical forecasts constructed from salesforce assumptions in collaboration with the acquisition team and used for multiple board-level presentations, enabling executives to confidently allocate capital for their 9-figure acquisition.
Robust data mart built by integrating and harmonizing multiple disparate data sources iteratively to power forecasting based on key business objectives.
Rapid implementation of shared insights
We worked closely with a leading biotech company to map a course of action to accelerate growth by acquisition of a synergistic product line. The client requested expert data-driven forecasts coupled with recommendations to determine which product assortment would optimize profits when combined with their sales and marketing capabilities. Throughout the multiple phases of this strategic forecasting project, we worked in frequent consultation with the Finance, Sales, and M&A/Development teams.
After the kickoff, we rapidly gathered and integrated primary data sources into a project data mart. We used this to create broad overview Tableau dashboards to explore the historic product performance across locations, over time, by product and product group, by indication, across competitors and by channel. We built several forecast models in the R statistical programming language to give high-level estimates of steady-state performance by channel, product and indication and incorporated these into the project data mart driving the first-phase Tableau dashboards.
With the Finance team, we jointly presented our insights from the initial phase at an in-person executive retreat, answering questions, reviewing opportunities and brainstorming ideas. Based on this presentation and the Executive team’s feedback regarding viable levels of investment, we identified relevant factors for the next phase of the analysis such as sales growth, marketing spend, and partnership options. We then mapped out a schedule for modeling more advanced and realistic scenarios based on the constraints they outlined.
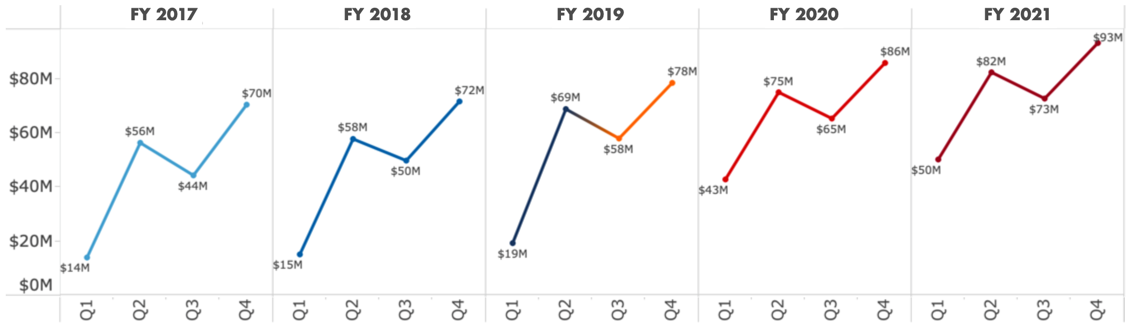
High-level forecasts of steady-state performance
“The YakData team's rapid efforts at data cleanup, regrouping and rationalization made the initial acquisition discussions a success.”
— Lead Business Analyst
Iterative learning and enhancement for real-world simulations
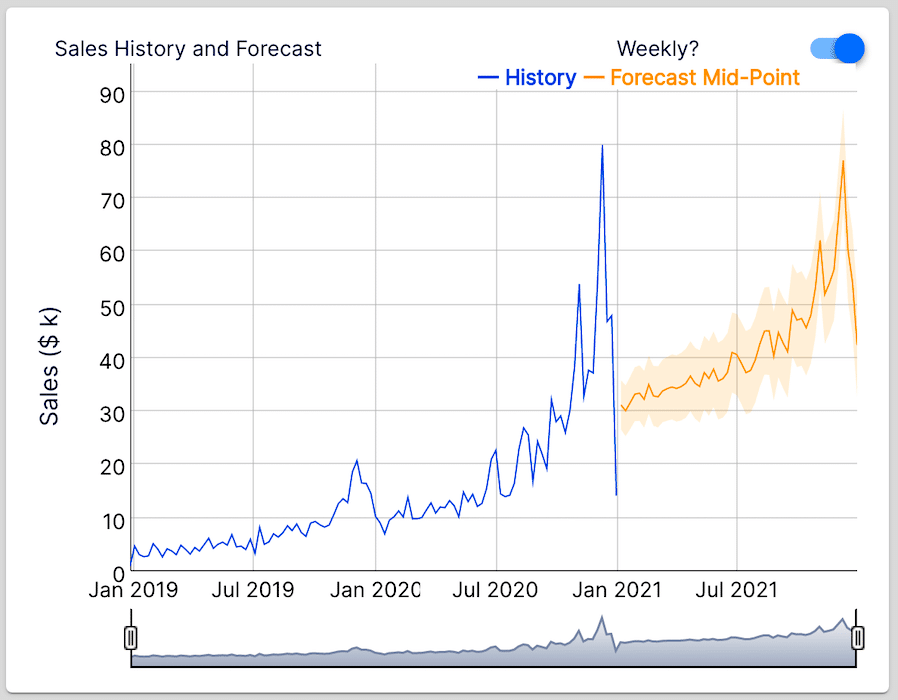
Working in partnership with the M&A and Sales leads, we developed R models of both systemic and external factors impacting sales. The CFO specified realistic constraints to the range of values acceptable for the variables used in the models, which we integrated into the initial core forecast Tableau dashboards.
To further enhance the utility and flexibility of the models and forecasts, we incorporated cash-flow model formulas from the CFO into the project data mart and displayed these in the Tableau dashboards. Additionally, we circled back, further enhancing the project data mart forecasts using advanced geographic hierarchical forecast models. We maintained the ability for the users to switch between the initial forecasts or the advanced hierarchical forecasts in the scenario dashboards, as needed.
The client asked for assistance in preparing a critical presentation for the Board of Directors. They required a clear, concise 30-minute slide deck that highlighted the inclusion of executive assumptions and identified key risk factors and likely results. We worked with the M&A and Finance teams to build this slide deck for the Board’s review. We also prepared a wide range of potential Q&A slides that might be useful at this meeting.
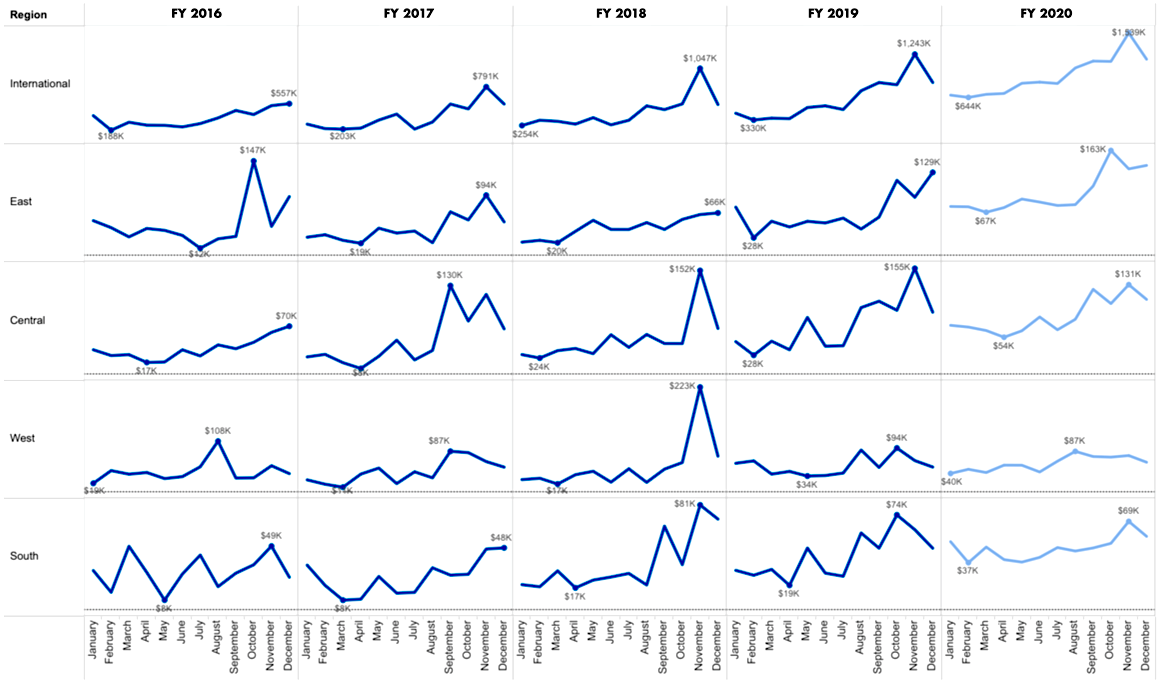
Revenue history and forecasts per sales rep
"These insights made the board rethink optimal capital allocation between salesforce growth with partial acquisition versus acquisition of the entire product line."
— VP of Finance
A clear path for acquisition decisions
As their acquisition progressed, we added KPI dashboards to monitor their investments and monitor future growth of the acquired product lines. We simultaneously worked closely with the IT team to begin integrating the project data mart into their enterprise data warehouse.
As the acquisition proceeded, the client evaluated the growth of their new product lines while organizing and informing the sales teams across multiple geographies. We continued to provide critical path analyses of complex, high-value questions that were beyond the expertise of the M&A and Finance teams.
"The models your team built of systemic versus external factors that impact price sensitivity provided the critical information needed to determine which long-tail items to retain."
— Director of Pricing
Details and Illustrations in this client success story have been modified to maintain client confidentiality.
CLIENT SUCCESS
Optimizing the retail workforce at a rapidly expanding consumer finance company
At a glance
A national consumer finance company was opening locations at an aggressive pace. They partnered with YakData to empower regional managers to tactically schedule staff to meet or exceed net revenue and margin targets. At the same time, the CEO wanted to improve shared situational awareness among the executive team and their direct reports.
For both phases of this project, we utilized R, Redshift, Excel, Tableau and Tableau Server. At the conclusion of this multi-phase engagement, our client was able to effectively enhance their growth strategy and greatly increase new salesforce hire ROI.
"YakData proved masterful at understanding the business, identifying what key actionable insights are critical, and then building the analytical and technical systems to support that. They look at what the business needs and works back to the technology and forecasts. Their insight is invaluable for improving ROI and driving quick wins from the analytical investment.”
— VP of Credit
what we delivered
Powerful and flexible forecasts, dashboards, and scenario modeling analyses for shared understanding and valuation of future scenarios by the executive team and regional salesforce managers.
Advanced models and hierarchical forecasts constructed from iterative analysis of historic outcomes. These were seamlessly incorporated into the forecast and simulation dashboards.
Robust data mart built by integrating and harmonizing multiple disparate data sources to power forecasting based on key business objectives.
Bringing together critical forecasts for greater team success
In the first phase, we worked with the executive and analytics teams to build a dynamic dashboard composed of hierarchical loan volume forecasts at the state and regional levels. We included controls for simulating various levels of salesforce growth. This project deliverable sparked better communications among and within the regions to efficiently allocate quarterly salesforce hires with less contention and quicker buy-in.
This is a simplified version of the dashboard delivered in this phase.
In the second phase, we worked closely with regional leaders to develop pro-active forecast interactive dashboards to facilitate effective hiring of staff and managing work schedules across their locations. These dashboards were designed to be powerful, flexible and relevant at the regional manager level with automated targets, staffing scenario modeling controls and easy comparison of the performance and forecasts of other regions.
In the final phase, we collaborated with the analytics team to build a compelling executive dashboard for daily summary updates so that executives and their direct reports could easily review team, state and regional performance versus quarterly and annual targets. Upon delivery, the CEO and CFO were so excited about this project dashboard that it was installed on a large touchscreen TV opposite the executive floor elevator.
Throughout this project, we simultaneously built a data mart dedicated to regional awareness and dynamic forecasting using the client’s core data systems and data warehouse. The data mart was shared with the enterprise data warehouse team for long-term integration back into the original data warehouse.
“We appreciate the way you helped roll all the work back into our core data warehouse team. You even helped them reconsider some of our best practices for optimizing our ability to add forecasting across the entire business!”
— CTO
To maintain client confidentiality, we generated representative sample data and merged details from multiple client success stories.
CLIENT SUCCESS
Discovering the hidden value in your customer data
At a glance
A boutique West Coast winery with multi-million dollar revenue approached us to provide guidance on designing a cutting-edge marketing program. Recent press coverage had attracted a lot of new visitors to their tasting room, the main channel of customer acquisition. After an in-depth investigation of the winery’s mostly untapped customer demographic and sales databases, we shared several exploratory models and analyses with the marketing team. Based on their insights and feedback, we built a dynamic dashboard for their daily use that integrated customer segmentation and lifetime value (LTV). With these new capabilities, the marketing team is able to reach each customer with the best message.
This dashboard was built by the YakData team under the name of our previous company. Tableau Software invited Stephen, now Principal Data Scientist at YakData, to present this project at their worldwide conference. Tableau Software continues to share this client success story as a white paper highlighting their product capabilities for sharing critical insights to increase ROI.
Download the in-depth client success story
Download the white paper "Discovering the Hidden Value in Your Customer Data"
[email-download-link namefield="YES" id="4"]
what we delivered
Powerful models to automate rapid customer segmentation based on customer behavior, demographics and channel of acquisition.
Customer lifetime valuation (LTV) models for real-time scoring of newly acquired customers, based on customer type, date acquired, discount levels and LTV percentile rank.
An elegant but easy-to-use data mart built by integrating and harmonizing multiple disparate data sources to enable point-of-sale scoring of newly acquired customers.
Quickly identifying high-value customers
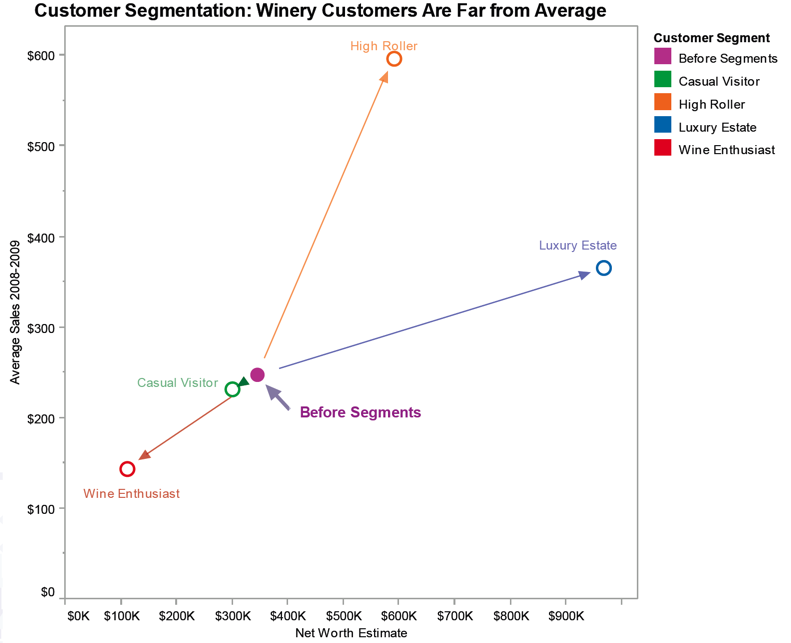
Before this engagement, the winery’s management identified general customer segments based on their tasting room observations and experiences. However, they were unable to target specific customer segments with tailored marketing programs and campaigns and contacted us to create a system to target the most profitable customers.
We used demographic and purchase data to identify customer segments incorporating every individual in the customer database, leading to effective segment-specific marketing.
“Thanks to this project, we built an efficient system for ongoing marketing spend and investment. Now we can acquire high-value customers at a much higher ROI AND capture low-value customers via profitable marketing tactics. This radically changed our approach to managing the wine room, our newsletter program, our e-mail program, our discount strategy and access to our exclusive VIP programs.”
— Founder and winemaker
Download the in-depth client success story
Download the white paper "Discovering the Hidden Value in Your Customer Data"
[email-download-link namefield="YES" id="4"]
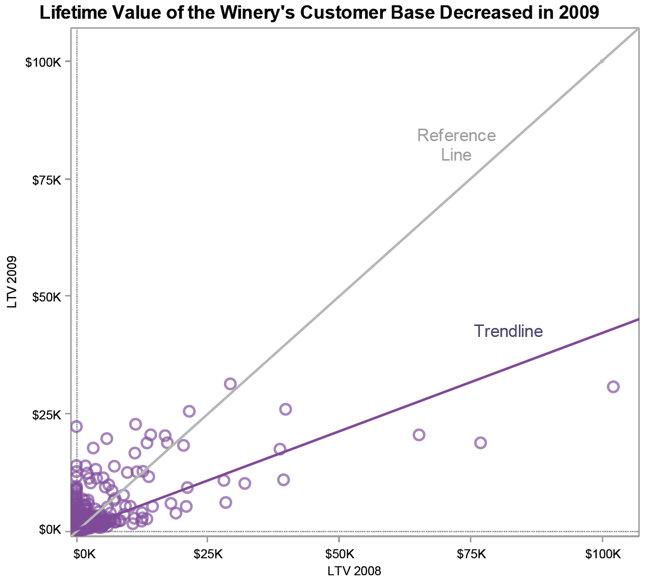
Lifetime Value Estimates (LTV): Look into the Future
Customer LTV models estimate the future value of an individual customer to a company and can help maximize the long-term ROI of a marketing program. The benefits of LTV are both tactical and strategic, as the results can be used to not only develop a particular marketing campaign but also to measure the true impact of a marketing program on sales over time. LTV is dynamic, incorporating more information about demographics and purchasing behavior as it becomes available to refine the model.
customer segmentation and lifetime valuation dashboard
This live dashboard empowers the marketing team to rapidly evaluate the effectiveness of their marketing efforts via dynamic filters across critical metrics and dimensions. They can examine performance by customer segment, year acquired and lifetime valuation. The team improved their targeting and messaging and optimized return on investment (ROI) of their marketing campaigns by exploring and learning from past successes and failures.
We just show a few highlights on this page.
Get the whole story!
Download the in-depth client success story
Download the white paper "Discovering the Hidden Value in Your Customer Data"
[email-download-link namefield="YES" id="4"]
To maintain client confidentiality, we generated simulated data based on the client data structures in this project.